
|
Geophysics foundations:
|
|
Measuring physical propertiesDuring a geophysical survey, energy is put into the earth and responses are recorded at the surface, in the air or in boreholes. Resulting data reveal information about the earth because the behaviour of the energy within the ground is controlled by the distribution of the earth's physical properties. For instance, one basic physical property is magnetic susceptibility, which describes a rock's ability to become magnetized. This physical property provides information on rock type and structures because the rock's magnetic susceptibility relates directly to mineral type, and to the chemical alteration processes involved in its deposition. A second important physical property is electrical conductivity, which quantifies a material's capacity to carry electrical current. Figure 2 illustrates one way that a geophysical survey can be carried out to provide information about the subsurface distribution of electrical conductivity.
Evidently, the application of geophysics to problems involving earth's subsurface is a non-trivial process. A seven step framework can be used to help understand each aspect of this process. This framework is outlined in a one page appendix. Traditional interpretationTraditionally, useful information was extracted from geophysical field results by examining maps or line profiles of raw or filtered survey data. Such images are useful for estimating locations and quantities of buried materials, and to help choose locations for more invasive (and expensive) techniques such as drilling. For example, large scale maps of magnetic of magnetic or gravity data often show geologic structure, or identify an anomalous region that might be associated with a desired target. As an example Figure 3 shows the magnetic data acquired at the Bathurst region of New Brunswick. The major features observed are related to geologic structure.
Historically, in mineral exploration, the identification of an anomalous region was often the endpoint of the analysis, and the image was used to plan the location of a drill hole. Unfortunately, the success rate was generally poor. At best, data maps provide some information about the lateral extent of a body but little information about what is happening at depth. Quantitative analysis, in particular inversion, is required to obtain 3D information. The mineral exploration example in this article expands on this. Other geoscience professionals also need to obtain quantitative information from data sets that are difficult to interpret without inversion. The geotechnical example in this article illustrates both traditional images of data and quantitative models generated by inversion of this data. Inversion
Due to the earth's extreme complexity, useful models often need to have many parameters, usually more than the number of data. This means that the problem of finding a model (i.e. estimating values for every parameter) is one in which there are more unknowns that data. Such problems do not have unique solutions, and this nonuniqueness is exacerbated when data are noisy or inaccurate. Formal inversion methods address these issues using well defined mathematical techniques. An appendix explains inversion in a little more detail. In the remainder of this article, some benefits of applying rigorous inversion can be seen by comparing the information in 3D and 2D models obtained by inversion, to the traditional map and pseudosection plots of the raw data.
|
 Geophysical surveys are performed when information about the earth's subsurface is desired but direct sampling through expensive and invasive techniques such as drilling or trenching is insufficient, impractical or ill-advised. A survey may be as large as the whole Earth, as small as the top few metres of the subsurface, or anywhere in between.
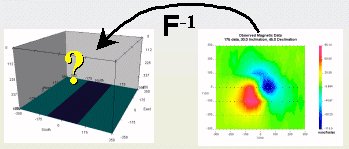 The problem of using recorded data to estimate a reasonable earth model (i.e. a quantitative distribution of one or more physical properties) is known as the geophysical inverse problem. The adjacent cartoon illustrates that the pertinant question being addressed is "what subsurface physical property distribution could have caused the data that were observed at the surface?" Earlier inversion solutions involved characterizing the earth by a few prisms or layers and then numerically finding geometrical and physical properties of these simplified earth models.