| |
Introduction
IP signals are often noisy because there are many signal sources in the ground that cause potentials that are of similar magnitude and/or frequency as the chargeability effect. Telford, Gledart and Sherriff, 1990 have a good discussion of noise on pages 589 - 591. The discussion below employs figures generated in the field using a full-waveform DC resistivity/IP system. Figures show voltages during transmitter off times only.
Clean data
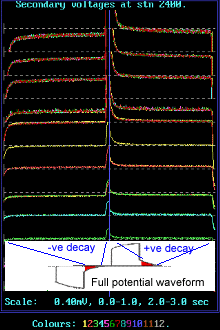
The figure to the right shows "clean" time domain IP signals on 12 potential measurments taken for one current station. Even on "clean" data, some electrical noise or chatter is visible. It is worth gathering multiple measurements and averaging (stacking) in order to reduce this type of random noise.
For this and subsequent figures, the survey involved a pole-dipole configuration with n = 1 through 12. Each figure shows 12 decay or discharge signals from both positive and negative transmitter cycles. Signals were gathered using a full waveform digitizing receiver. |
 |
"Cultural" noise
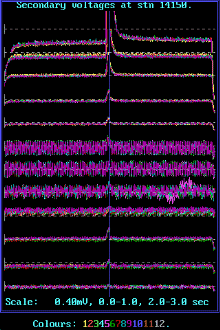
Sometimes power lines are nearby, or there are fences or other sources of current channeling. We refer to signals caused by these and other man-made features as cultural noise. Here is an example using the same format as the first figure. 60Hz is clearly evident at location n=6, n=7, n=8, and n=9, which are the 6th, 7th, 8th, and 9th decay signal pairs down from the top. |

|
Spherics
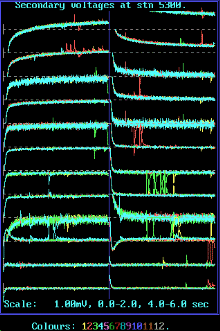
Spherics are spikes caused by nearby and distant lightning strikes. They can usually be filtered out, but this is harder to do in time domain data sets where significant energy can be added to individual decay curves. It is hard to remove from stacked data unless individual stacks with spikes can be identified and removed. This is not a commonly available solution since data are usually stacked in real time and only the results are saved. When viewing the image, note that each colour represent different "stacks" or repeat measurement. |
 |
Geological "noise"
Small scale effects near the electrodes that overwhelm the more important deeper targets are the most common problem. Other aspects to remember include conductive overburden masking underlying structure, topographic effects, 2D interpretation of 3D geology, current channeling due to cultural features (fences, etc.) and geological lineations (stream beds, buried dykes, etc.), and anisotropy. Some of these effects can be minimized by proper use of inversion techniques, but there will always be limitations with these methods, including limitations on cell size, and use of 2D methods when 3D structures are significant.
Tellurics
Telluric signals are currents in the ground that are caused by variations in Earth's magnetic field, which in turn are caused by interactions of the solar wind (charged particles) with the ionosphere. Telluric currents tend to vary at frequencies of around 0.1 to 10 Hz, which is exactly the range for time domain IP measurements. These signals can be very large in conductive ground - up to several volts compared to the few millivolts often used to record the apparent induced polarization.
| One approach to minimzing the effect is to measure the phenonmenon at a distant location (unaffected by transmitter currents) and subtract this reference from data. This assumes that telluric currents are the same over great distances, which may be more or less true at different field sites.
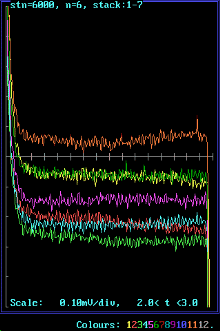
The example here shows seven decay signals (following the positive transmitter pulse) collected within 30 seconds. They should all be identical, but there is serious drift making it look like there is a variable SP (spontaneous potential). In fact, some of the signals are clearly on a drifting trend. Minor 60 Hz noise can also be seen. See the sidebar for an animated version of this figure.
Frequency and phase measurements are less susceptible to this type of noise, but they suffer from EM coupling. |
 |
EM coupling
Inductive or EM coupling is a serious form of noise that is discussed in the section on measurements and data. |
|

