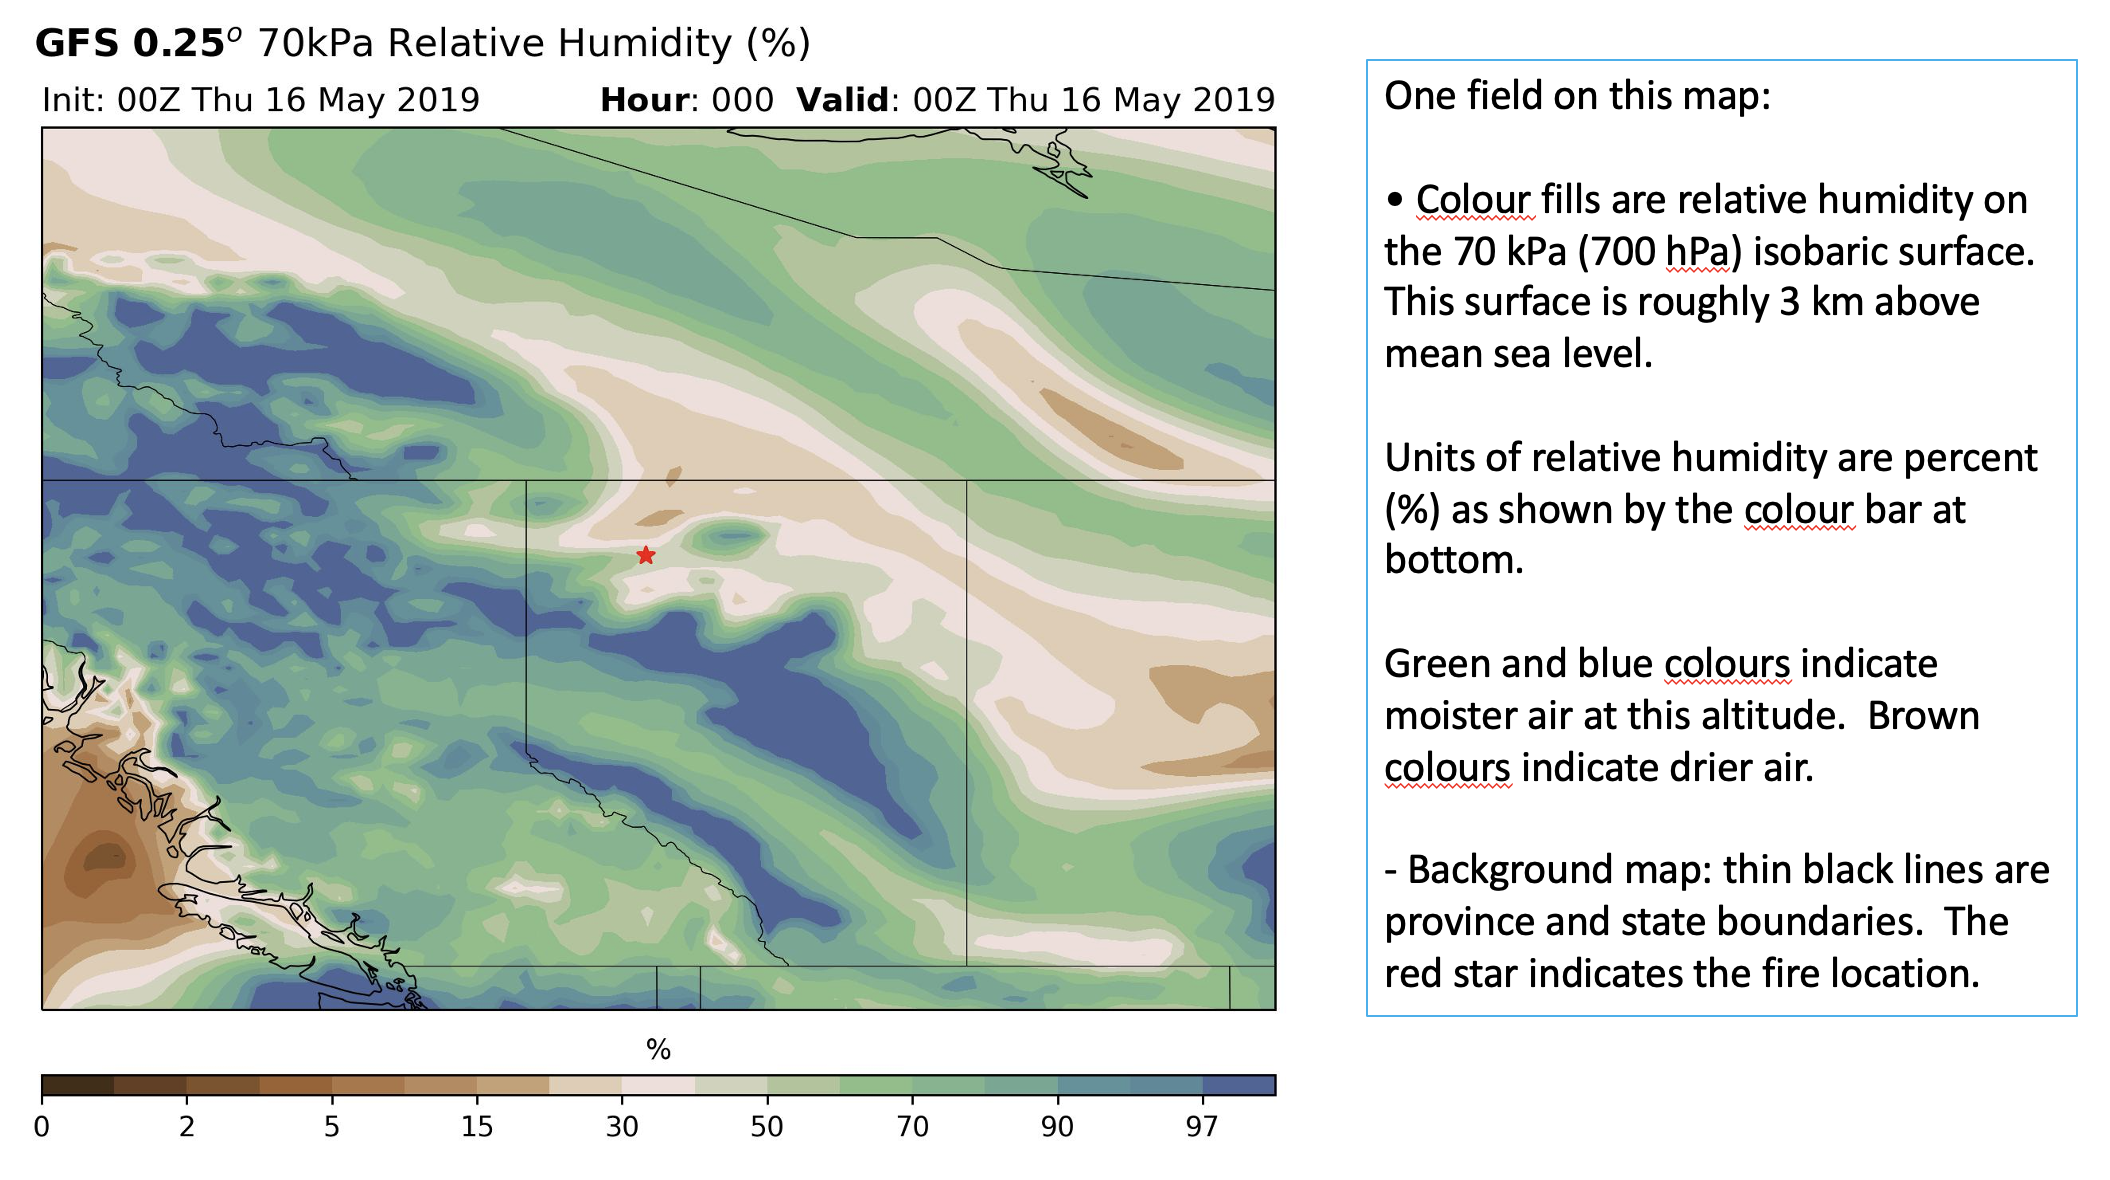
This map is a bit more zoomed into the fire location. By animating the map (stepping forward or backward in time), we can see how the humidity is increasing or decreasing in the air roughly 3 km above the fire site.
Generally drier near ground level air favours fire growth, while humid air suppresses it. Although this map is for air 3 km above ground, it shows reservoirs of dry or moist air aloft that could be mixed down to the fire. Such mixing could be due to a very deep afternoon turbulent boundary layer, or could be caused by vertical mixing by convective clouds (deep cumulus clouds), or could be caused by vertical motions near a front, or could be caused by mountain waves if the fire site is in or near the mountains.
We sometimes use mid tropospheric humidity as a surrogate to indicate likelihood of clouds at that level, although modern NWP models can output cloud coverage directly.
Estimates of high moisture content at this height level may also be helpful for forecasting plume-dominated fire behavior and pyrcumulonmbus or Flammagenitus cloud formation. Current research shows low-level moisture and instability are key ingredients for plume-dominated fire behavior pyroCB formation (Fromm et al 2022).