
Contents:
• 3 h Precipitation Rates,
• Total Accumulated Precipitation,
• Near-surface Relative Humidity,
• Near-surface Temperature and Temperature_anomaly,
• Winds at 10 m AGL and 100 m AGL, and
• CAPE.
This shows the depth of water that would have accumulated in a rain gauge during the 3 hours ended at the time and date indicated at the top of the forecast chart.
Heavy rain can extinguish fires, and can soak more deeply into the forest floor to reduce the drought index. Light or moderate rain might offer some temporary relief by dampening the surface fuels and thereby reduce the chance of new surface ignitions, but can do little to alleviate drought conditions deeper in the forest floor.
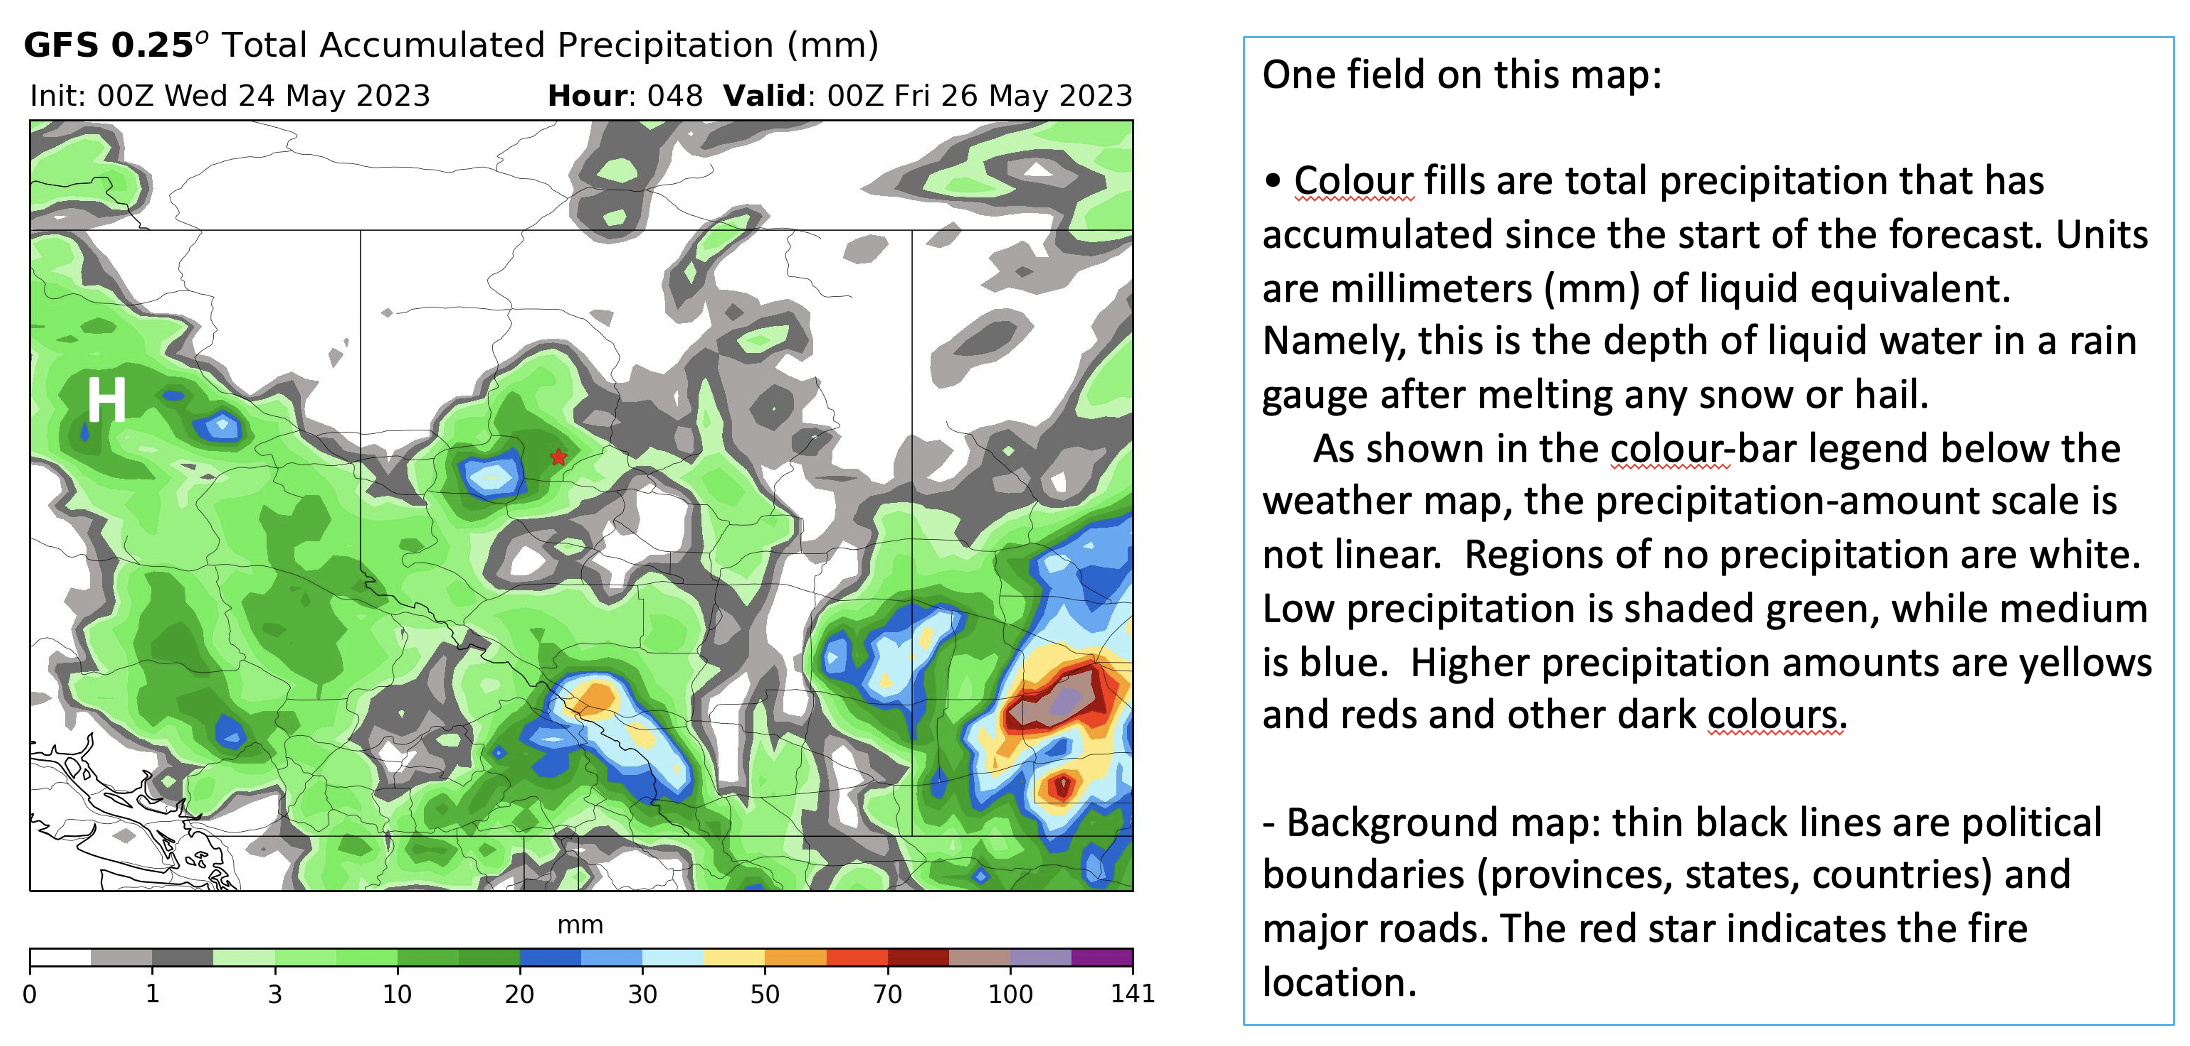
This shows the total depth of water that would have accumulated in your rain gauge during the time interval between the initialization (Init) time of the forecast and the current valid time. The sample image shown above show total accumulated precip. during the 48 hours since the NWP model was initialized.
By taking the difference between total accumulated precipitation at time tA and time tB, you can infer the amount of precip that fell during that time interval. This allows you to compute daily precip. and storm total precip. as might affect the various fuel mosture codes.

Relative humidity (RH) is the amount of moisture in the air "relative" to the max amount it could hold at saturation. As you might expect, the relative humidity can decrease if the amount of water vapour in the air decreases. More surprising is that the RH can also decrease if the amount of moisture is constant, but the air temperature gets warmer (implying that the air could hold more moisture if it were saturated).
At high humidities, water vapour from the air can be absorbed by dry/dead vegetaion, increasing the fuel moisture content and making it more difficult to burn. Conversely, low humidities can cause water to evaporate from moist dead fuels, causing them to ignite more easily. Live leaves and needles have stomata, which are pores in the surface of the leave to allow CO2 into the leaf from the atmosphere, to enable photosynthesis. Sadly, these same stomata allow water vapour to be lost from the living plant when the RH in the air is low. Namely, live plants become dissecated (dried out) and can die.
On sunny days, air temperature usually increases toward mid to late afternoon. Thus, RH is anticipated to be lowest then, increasing the potential for wildfires at that time.
Wildfire fighters often compare the relationship between RH and 2 m temperature in degrees C. When the 2 m Temperature exceeds RH (for example, T2m = 33C and RH2m = 25%), the firefight community deems this a “CROSS OVER.” It creates high awareness in the fire crews as the potential, because extreme fire behavior is more common. Note that this is an anecdotal thing used in the wildfire community. See a discussion on pages 38-40 in the Weather Guide for the Canadian Forest Fire Danger Rating System. (This topic is also covered in our Fire Basics fb16).

Air temperature. By animating or looping the image in time, you can see if the fire site will be getting hotter or colder in the near future.
Warmer temperatures generally favour fire formation and fire growth, due to the drying of vegetation that becomes the fuel for fires. This is also relevant for "cross-over" times of increased fire danger, when air temperature (°C) exceeds the relative humidity (%), as discuss in the previous section of this web page.

A temperature anomaly is a difference between the air temperature at this one time on this day from a multi-year average for the same day. It is normal for air temperatures to get warmer and colder than average on different days as the weather changes, so we will always see anomalies.
Wildfires and wildfire threats grow when the air is relatively hot, dry, and windy. This temperature anomaly map helps you to find regions that are hotter than average; and hence might have a greater wildfire threat. Animate this map by stepping forward or backward in time to see how fire conditions might change in the near future.
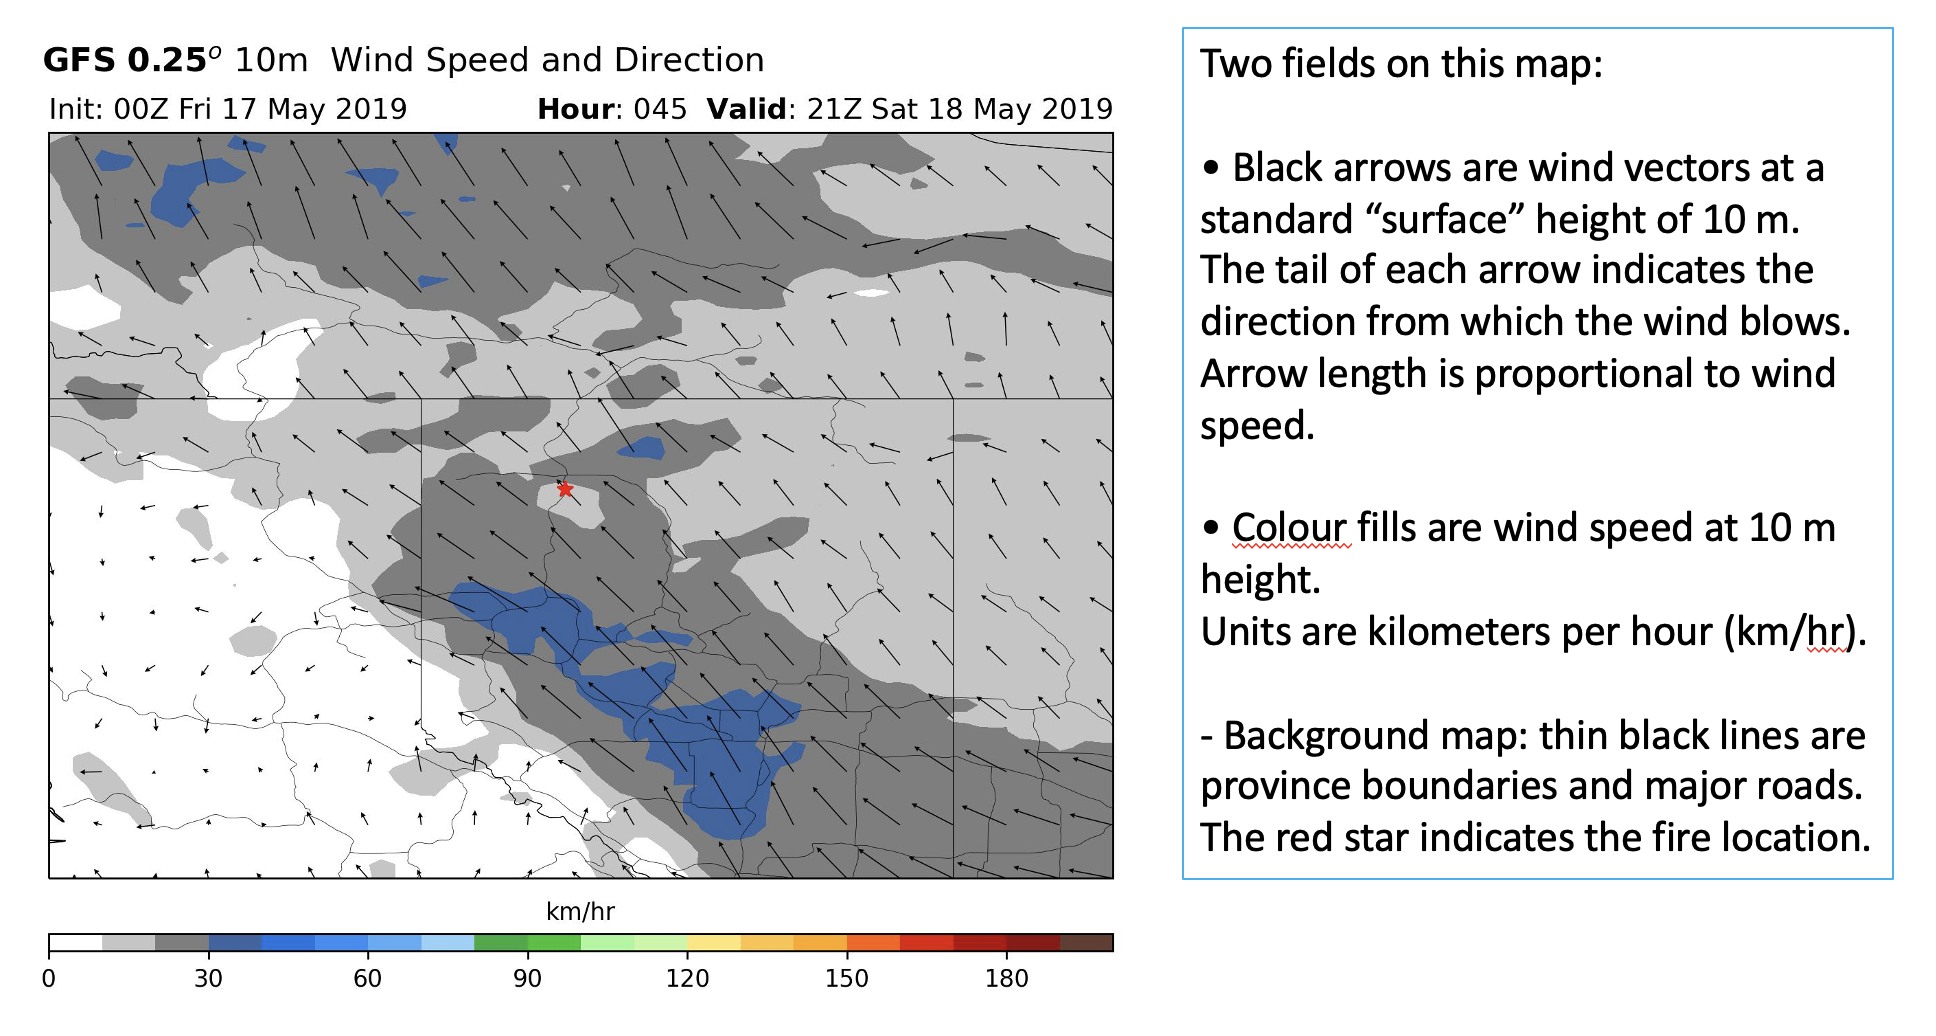
In the absence of terrain slopes, fires generally spread faster downwind than upwind, as indicated by near-surface winds. Faster winds generally cause more vigorous fires that expand more rapidly.
Animate this map by stepping forward or backward in time to see how fire conditions might change in the near future. Changes in wind direction and/or magnitude in wind speed are always important to monitor near a fire as they can drastically alter a wildfire's behavior.
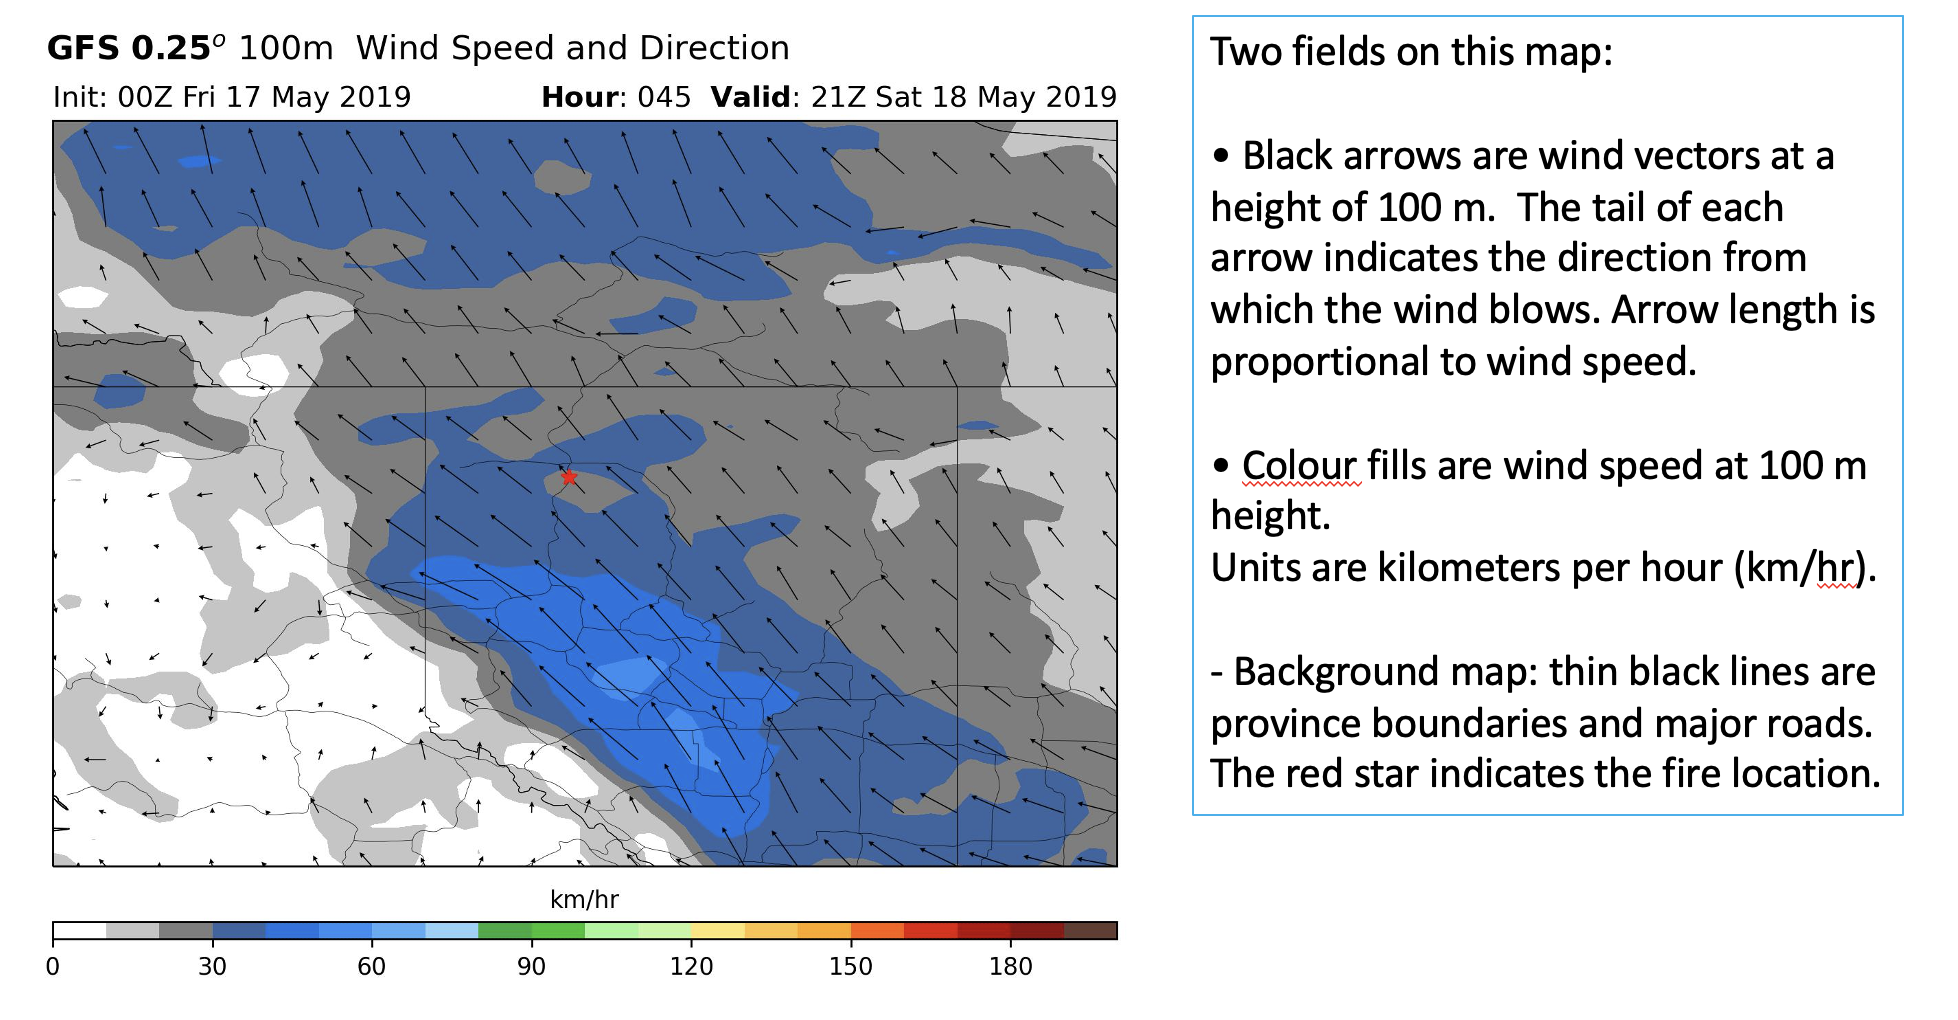
These winds are roughly at the hub height of modern wind turbines. At night when a statically stable boundary layer forms, the wind near the ground can become slow or calm, while the winds aloft in the ABL residual layer at z = 100 m can still be very fast. This is known as a low-level jet.
If a low-level jet of air existings over the fire site, then there is the threat that these fast winds could be moved down toward the surface by turbulence or convection in the lower atmosphere. If this causes a sudden increase in wind speed at the surface, then fires could suddenly increase in intensity and propagation speed.
Same as at 10 m winds, but helpful to look at to assess wind speeds above the fire. Fires can alter the ambient winds and can mix these faster winds down to flame height, amplifying wildfire growth. Also, if instability is present, wind speed and direction at this height may be helpful for inferring locations of potential "spotting" fire behavior and locations (where embers from the main flame front are blown by the winds to start spotty fires ahead of the main flame front). However, this is a poorly understood area in wildfire science, and much more research is needed on this important phenomenon.
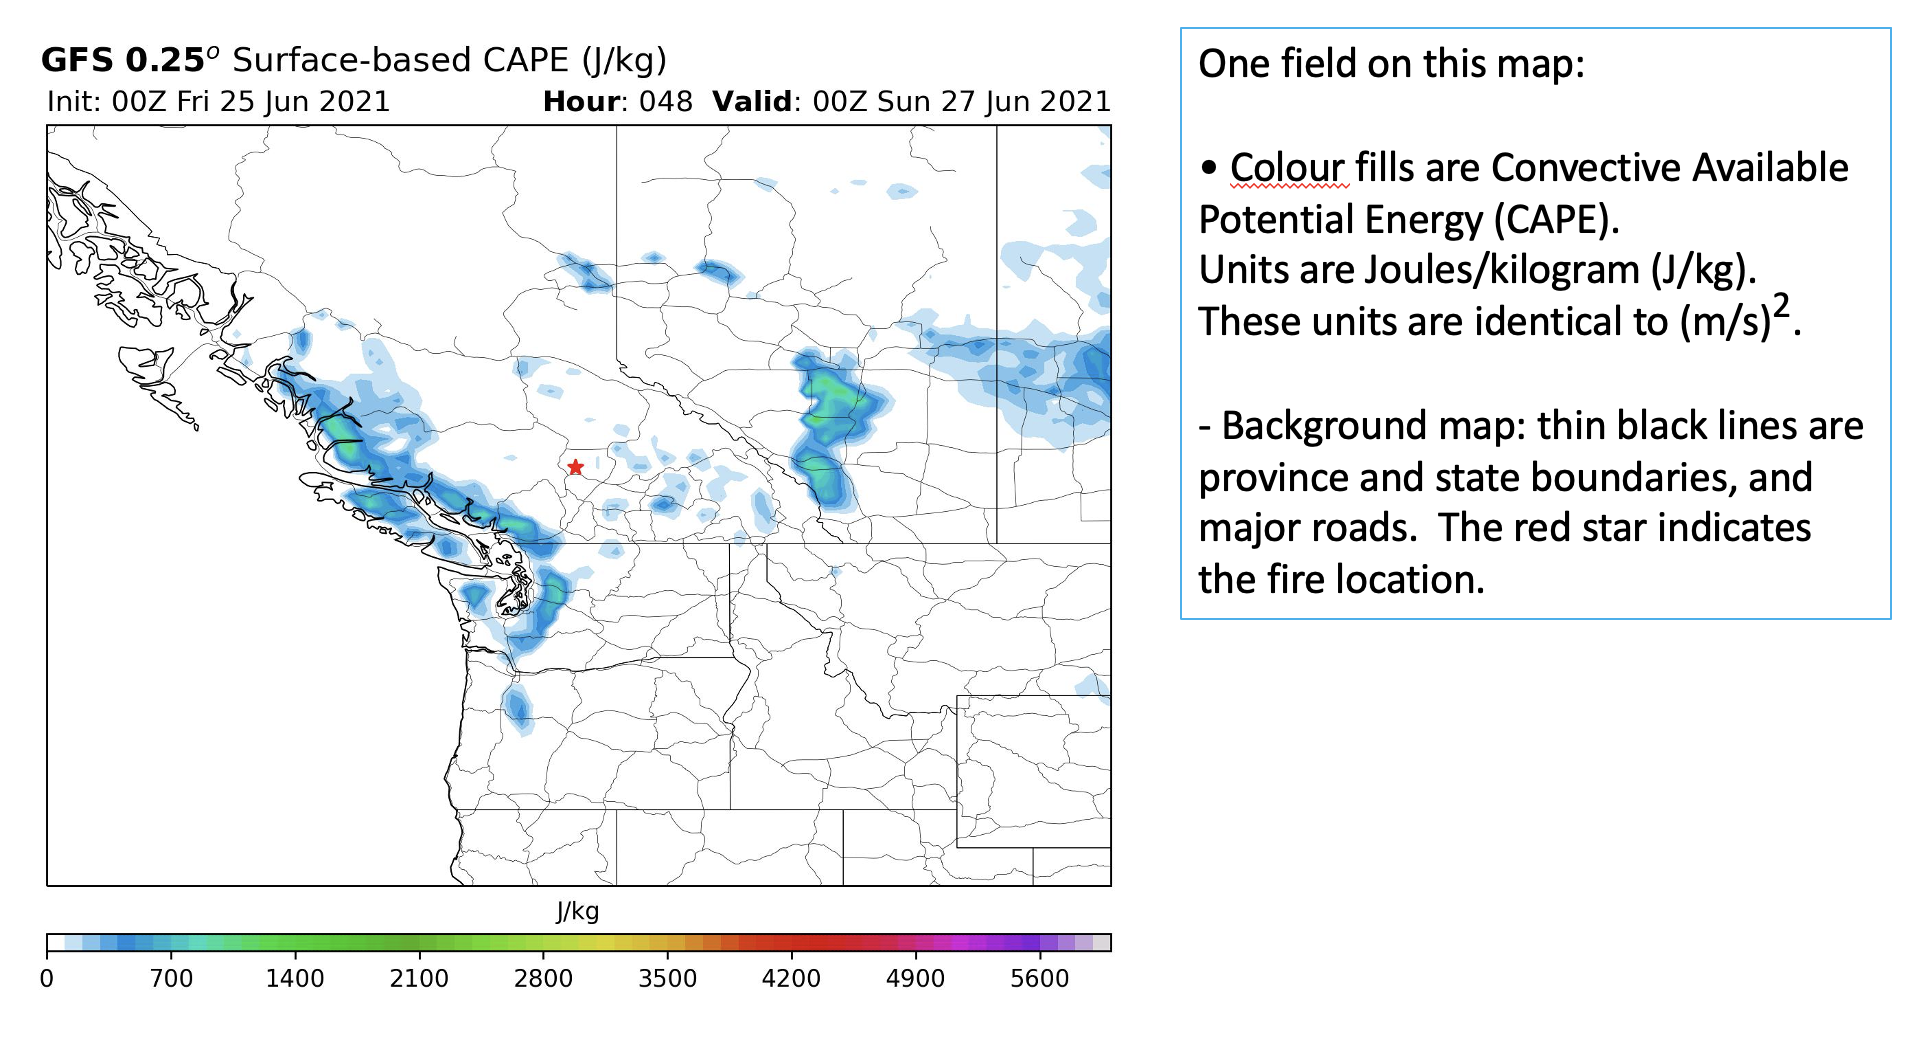
CAPE indicates how much energy could be released if a thunderstorm forms. However, for a thunderstorm to form, it also needs a trigger mechanism to "kick start it", to get the air to rise past a capping inversion. Larger CAPE indicates stronger up- and down-drafts, heavier rain, stronger gust-front winds, chance of hail, and chance of tornadoes. Sadly, it also indicates greater chance of lightning that could spark other wildfires.
Positive CAPE and high moisture content at low altitudes (~70kPa) may be helpful in predicting pyrcumulonimbus or Flammagenitus cloud formation. However, there are a lot of unknowns about how these clouds form — it is an active area of research.
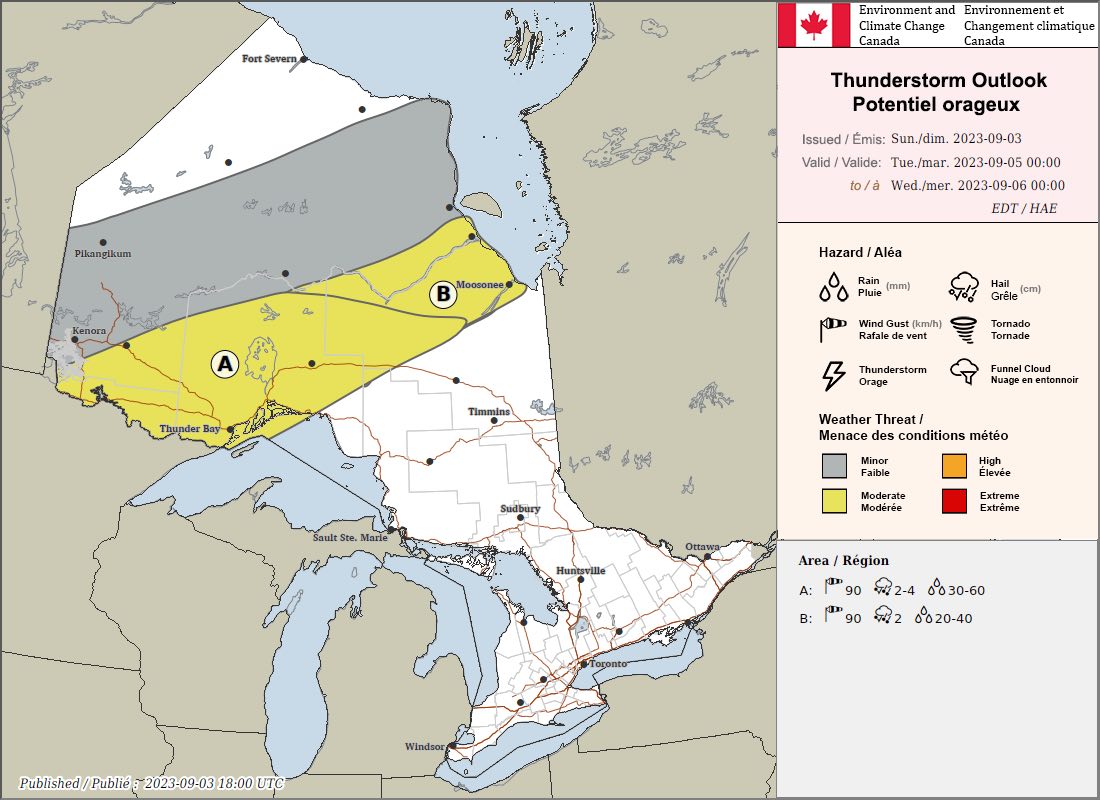
Meteorologists look at CAPE (indicates how strong a thunderstorm might be, if it forms), CIN (Convective Inhibition, which tends to prevent formation of thunderstorms), and trigger mechanisms (cold fronts, gust fronts, forest fires, etc.) that can overpower the CIN to enable the CAPE to be released to form a strong storm. For example, the US NWS publishes convective outlooks, and Canada ECCC publishes thunderstorm outlooks (see example in the figure below) that are based on all these factors. You can access live ECCC thunderstorm outlooks at https://umanitoba.ca/environment/envirogeog/weather/conv_otlk/ .
However, if you don't have access to a convective outlook, you can use CAPE along with sounding info on a thermo diagram (see Chapter 5 of Stull's PrMet book) to gauge likelihood of a storm (see thunderstorm indices in Chapter 14 of Stulls PrMet book).