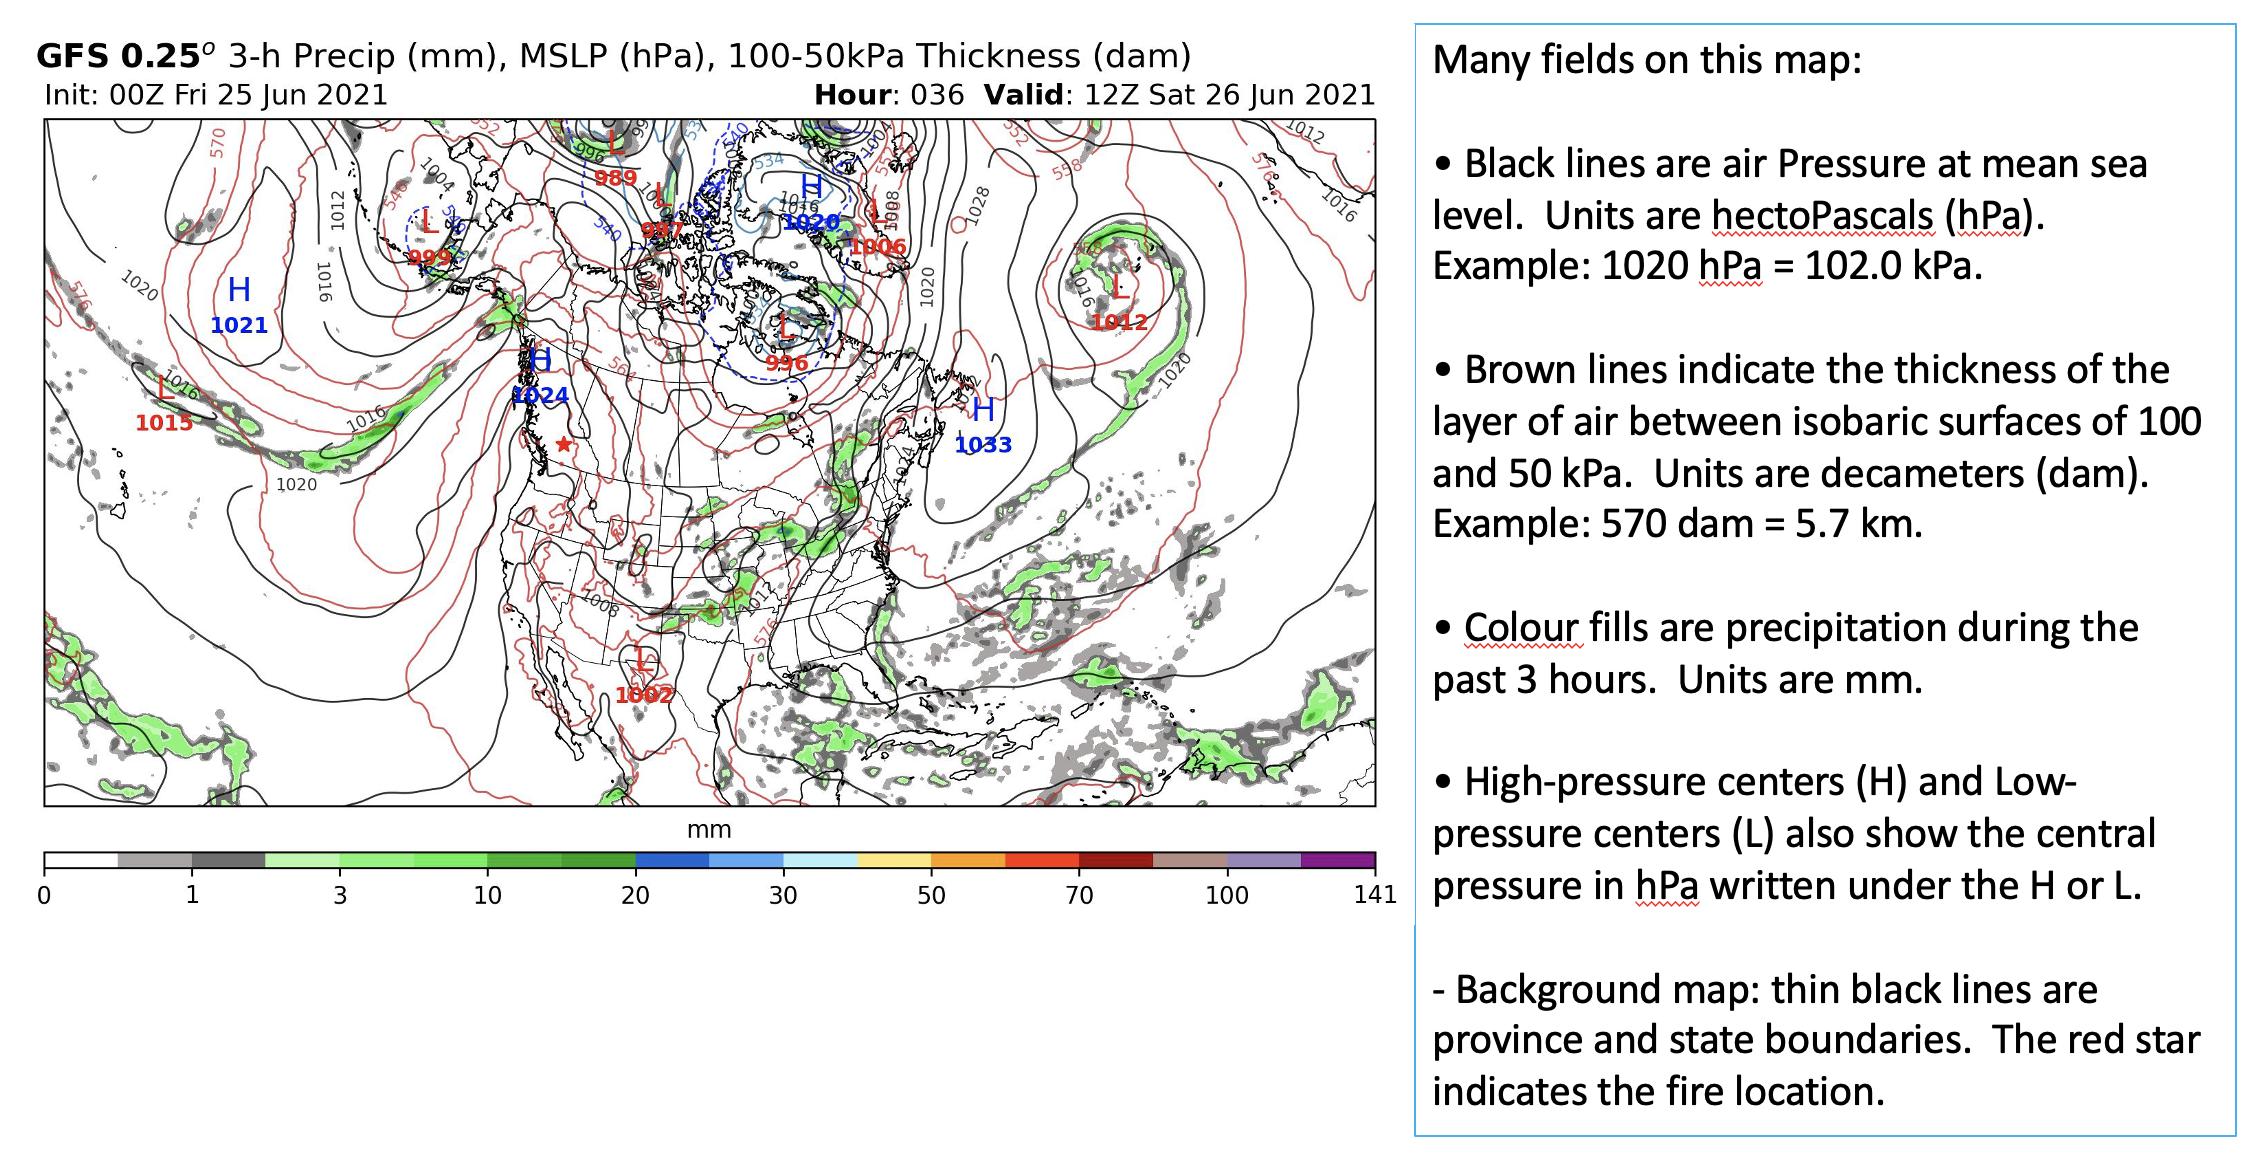
Winds blow somewhat parallel to the isobars in a direction such that low pressure is to the left of the wind vector in the N. Hemisphere. But due to turbulence in the atmospheric boundary layer, the near-surface winds cross the isobars at a small angle toward lower pressure. Winds are faster when isobars are packed closer together. So the isobars allows us to estimate near-surface wind speed and direction. See chapter 10 of Stull's Practical Meteorology for a review of atmospheric dynamics (forces & winds).
The thickness between the 100 and 50 kPa isobaric surfaces is proportional to the average temperature in that layer. This is described by the hypsometric equation (chapter 1 of Stull's PrMet book). The thickness is greater when the air is warmer in the bottom half of the troposphere. This tells us how surface pressure features (highs, lows) related to pressure features near the middle of the troposphere (near 50 kPa).
Thickness also tells us how the geostrophic wind will change with altitude (see section 11.6 of Stull's PrMet book) via the "thermal wind effect".
Precipitation helps to identify frontal zones and regions of convection such as thunderstorms.
Winds inferred from the isobars tell us how fires might spread. Also, animation of the isobars over time can indicate whether calmer conditions (associated with high pressure) or windier conditions (associated with low pressure) are approaching a fire site. However, high pressure is also associated with cloudless skies and abundant daytime sunshine, which can dry forest fuels and make them more combustable.
Precipitation can suppress existing fires, and damp soil and fuels can reduce the likelihood that fires can start or spread.
Although this map is useful for understanding the interplay between dynamics and thermodynamics in the atmosphere, you rarely need to use it because modern NWP can output directly any field that you really need (such as surface winds, humidity, cloud cover, and various fire indices, etc.).