UBC ATSC 413 - Forest-fire Weather & Climate

Case: Lahaina, Hawai'i

This town is on the west side of Maui island.


Overview

Brief Chronology:
  • The fire started at 6:34 am HST on 8 Aug 2023 as a small brush fire on the east (upslope) side of town.
  • This "AM" fire was extinguished by 2:17 pm, and fire fighters left the scene.
  • But the fire re-ignited at 2:55 pm.
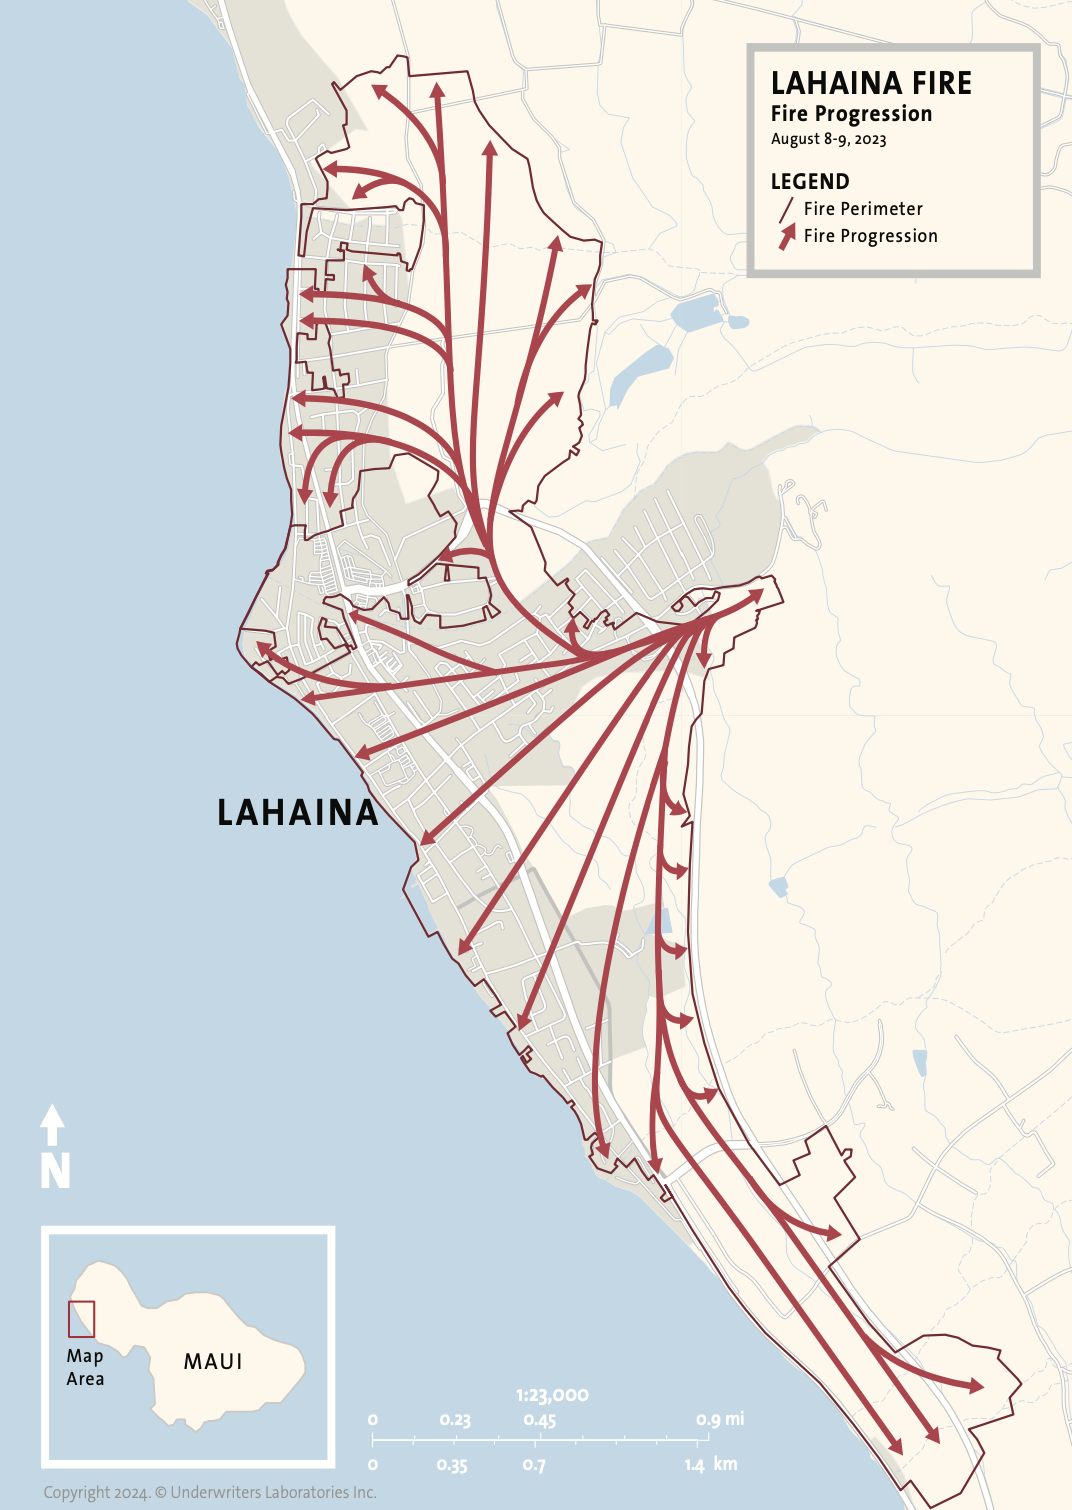
  • The grass fire at the wildland urban interface (WUI) transitioned to structure fires in town.
  • Very strong downslope winds from the east caused rapid spread westward thru the town of Lahaina.
  • Surface winds speeds were 40 mph gusting to 60 mph (64 km/h with gusts to 97 km/h).
  • Although still burning in places, the main fire advance thru town ended in early morning on 9 Aug.
  • As of 3 Sep 2023 the fire was 100% contained.
Fire Facts:
  • Official Name: "Lahaina AM fire" and "Lahaina PM fire"
  • Total burned area: 2,170 acres = 878 ha
  • 1.5 days out of control
  • 101 to 115 fatalities. About 2,200 buildings burned. Losses estimated at $6B.
  • Strong winds (70 mph just above the surface) and the quick fire advance reduced the ability of helicopters to respond.
  • About 20 personnel fought this fire, mostly from the local fire departments. There were several fire engines deployed, but two engines were destroyed by the fire.
  • Evacuation orders were given for esentially the whole town, but many residents were not aware of the orders. No sirens sounded.

News Stories, including Photos and Movies

Timeline of Fire and Weather Evolution

Detailed Weather Analyses and High-Resolution Modeling

Maps and Data on Weather and Fire Conditions that You Can Access for this Event

  1. Geography of Maui (Google Maps (3-D view) , and Maui topo map , elevation contours , USGS high-res topo map , )
  2. Antecedent conditions: Global Wildfire Info System: GWIS (turn on the Fire Danger Forecast, and select the date) .
  3. Surface weather map from the NOAA Weather Prediction Center (WPC): Surface weather map (use the Calendar button to select the date, and then zoom to your region of interest). Also see an explanation of map symbols from the NOAA Jetstream tutorial site.
  4. Polar-orbiting satellite views of thermal anomalies (i.e., wildfire hot spots) via NASA's Worldview of satellite-observed hot spots, (select the date at bottom left, turn on place labels and boarders/coastlines, select Terra and Aqua/ MODIS orbital tracks, and turn on Fires and Thermal Anomalies.
  5. To see Synoptic Weather Maps for this case, use the Forecast Tools link at the top of this web page. Click on the xxx fire button, and use links in the left frame to select the weather maps you want to view. Use the arrow keys on your computer to step forward and backward in time.
  6. xxx
  7. xxx


Photo credits:
top - Steve Kerber & Derek Alkonis., 2024:Underwriters Labs Inc., https://doi.org/10.54206/102376/VQKQ5427
bottom - landsat image of fires in Lahaina: https://earthobservatory.nasa.gov/images/151688/devastation-in-maui