UBC ATSC 413 - Forest-fire Weather & Climate

Case: Fort McMurray, AB

Issues include: the Wildland Urban Interface (WUI), impacts to industry and the economy, weather and climate

Under construction.


Overview

Brief Chronology:
  • The fire starting on 1 May 2016 due to human activity.
  • Grew to 2,656 ha by 2 May, resulting in partial evacuations.
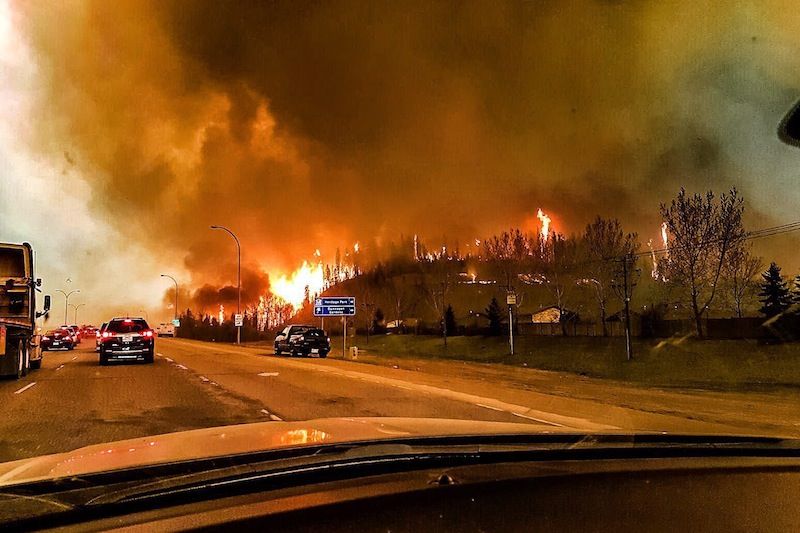
  • By 3 May the whole town was evacuated. Fire approaches and then jumps Hwy 63 (see photo), impeding evacuation. Two die in car crash.
  • On 4 May, Alberta declares provincial state of emergency. Fire grows to 85,000 ha.
  • On 10 May two of the main fires merge, to create a blaze of 229,000 ha.
  • On 16 May all oil-sands workers evaculate the camps north of town.
  • Residents allowed to return on 1 June 2016.
  • On 2 Aug 2017, the fire was finally extinguished.
Fire Facts:
  • Fire ID: MWF-009.
  • Official Name: "Horse River Wildfire"
  • Total burned area: 589,552 ha
  • Destroyed 2,400 homes and businesses
  • Required over 2000 fire fighters
  • Over 2000 personnel fighting this fire, including 200 from USA, 60 from Mexico, and 298 from South Africa.
  • 88,000 people were evaculated.
  • Total cost: $4,068,678,000. plus $3,600,000,000 insurance payments

News Stories, including Photos and Movies

Timeline of Fire and Weather Evolution

Relevant Videos

Wildland-Urban Interface (WUI) - Cascadia Webinars accessible from this YouTube Playlist
https://www.youtube.com/playlist?list=PLQvQiqeQdTK68OFN6706xECEbxwTpYUpR

Reading Assignment

Maps and Data on Weather and Fire Conditions that You Can Access for this Event

  1. Geography (Google Maps and Alberta topo map )
  2. Antecedent conditions: Global Wildfire Info System: GWIS (turn on the Fire Danger Forecast, and select the date) .
  3. Surface weather map from the NOAA Weather Prediction Center (WPC): Surface weather map (use the Calendar button to select the date, and then zoom to your region of interest). Also see an explanation of map symbols from the NOAA Jetstream tutorial site.
  4. Worldview satellite images: https://go.nasa.gov/3L19OHm
  5. To see Synoptic Weather Maps for this case, use the Forecast Tools link at the top of this web page. Click on the Fort McMurray fire button, and use links in the left frame to select the weather maps you want to view. Use the arrow keys on your computer to step forward and backward in time.
  6. Another relevant paper (not assigned reading): McGee, T.K., 2019: Preparedness and experiences of evacuees from the 2016 Fort McMurray Horse River Wildfire. Fire, 2 (13), 17pp. doi:10.3390/fire2010013 .

Photo credits:
Top: Twitter.com/Jerome Garot/EPA, via https://www.theguardian.com/cities/2016/may/16/fort-mcmurray-alberta-canada-worlds-most-fire-prone-cities
Bottom: https://earthobservatory.nasa.gov/images/87988/wildfire-spreads-in-fort-mcmurray