Introduction
Note: before gaining an appreciation for what makes ground chargeable, it is useful to understand why the DC electrical resistivity of the ground varies. See the Electrical Resistivity chapter.
The chargeability of earth materials is essentially an electrochemical effect caused by many factors, not all of which are completely understood. If ground is chargeable, it responds as if resistivity was a complex quantity. In other words, a phase shift occurs as ground responds to an oscillating input current. Therefore the chargeability can be measured in a number of ways using time domain or frequency domain techniques. Aspects affecting the chargeability of a sample include:
- The grain size of particles in the sample;
- The types of minerals present;
- The type and mobility of ions within the pore fluids;
- The details of microscopic interactions between solid surfaces and fluids;
- The amount of surface area within a specific volume.
Microscopic effects cause macroscopic chargeability
The list above suggests that surface physics will be an important part of explaining the phenomenon. For example, clays tend to be chargeable while sandstones are not, and the microphotographs here illustrate one reason why this is true. In addition to the high surface area, the surface interactions between clay minerals and fluids enhance the ability of these materials to hold charge.
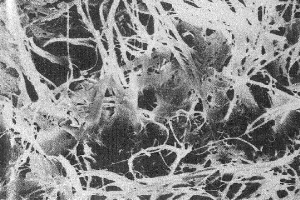 Illite (a clay mineral) with surface area of 100m2/gm (1000 times greater than sandstone) . |
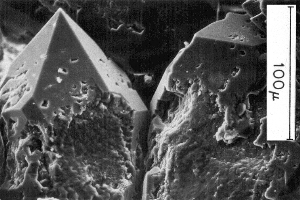 Quartz overgrowths in sandstone with surface area of 0.1m2/gm |
There are two primary causes of chargeability. In both cases, the re-distribution of charges (charging) takes some time to occur when an external DC electric field is applied. Equivalently, it takes the same time to revert to a balanced charge distribution (discharging) once the electric field is removed. "Charging" is hard to measure in practice. "Discharging" is measured using time domain IP survey techiques. The effect of charging for a finite time on sinusoidal signals at different frequencies also can be measured using frequency domain or phase IP surveys. The two types of polarization, which will be described subsequently, are called "membrane polarization" and "electrode polarization."
Membrane polarization
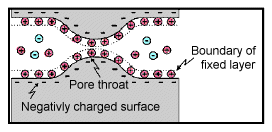 |
Membrane polarization occurs when pore space narrows to within several boundary layer thicknesses (which is the thickness of ions adsorbed to a surface). |
 |
Charges cannot flow easily, so they accumulate when an electric field is applied. |
 |
The result is a net charge dipole which adds to any other voltages measured at the surface. |
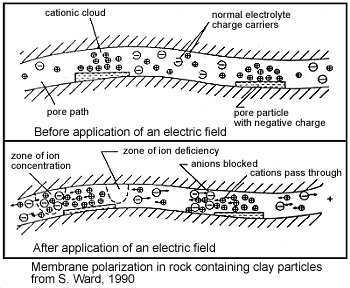 A second form of membrane polarization is similar to the first:
This occurs where clay particles partially block ionic solution paths, as in the adjacent figure. Upon application of an electrical potential, positive charge carriers pass easily, while negative carriers accumulate. There is an "ion-selective membrane".
A surplus of both cations and anions occurs at one end of the membrane, while a deficiency occurs at the other end. The reduction of mobility is most obvious at frequencies slower than the diffusion time of ions between adjacent memebrane zones; i.e. slower than approximately 0.1 Hz. Conductivity increases at higher frequencies.
Electrode polarization
 |
Electrode polarization occurs when pore space is blocked by metallic particles. As a result, charges accumulate when an electric field is applied. |
 |
The result is two electrical double layers which add to voltages measured at the surface. |
|
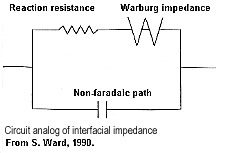
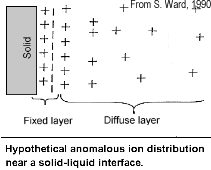
Comments on electrode polarizationSome remarks are appropriate here in order to provide some sense of the complexity of the chargeability phenomenon. At an interface between ionic and metallic conduction (for example, an ore grain in pore water), there is an impedance involved in getting current to flow across the barrier. These interfaces look like the top figure and have the simplified circuit analogue shown in the bottom figure. Current can flow via charge transfer (or ion diffusion) which involves electrochemical processes, or via a capacitive effect (no charge transfer) involving diffusion currents. Ion diffusion is not easy to model with circuit elements. The process is called the Warburg impedance. Its magnitude varies as approximately 1/frequency. |
|
Note that while it is useful to understand simplified models of the relevant electrical behaviour of surface-electrolyte interactions, all rocks are, in fact, "dirty" in the sense that they consist of semiconducting mineral grains rather than pure "electrodes," and pore solutions rather than electrolytes. There are other materials and particles affecting ionic behaviour within and outside the diffuse layer, and some of the sample's constituents will affect the behaviour of the fixed layer near and on the liquid-solid interfaces.
Summary of what affects the chargeability of material
- Induced polarization is greater when there are larger regions of adsorbed anomalous charge (adjacent to an interface); i.e. when there is a large surface area to volume ratio.
- Non-ionic fluids (such as contaminants) can markedly change the behaviour of surface-electrolyte interactions.
- Changes in ion concentration (such as increased salinity) will also affect both types of polarization.
- Both effects (membrane and electrode polarization) are related to grain size as much as material type. Therefore, determination of mineral type on the basis of chargeability alone is not recommended.
Typical chargeabilities for materials
The following tables (from Telford et al, 1976) provide a very general guide to possible chargeabilities of materials. One reason why in-situ chargeabilities tend to appear lower than laboratory values is that field measurements involve currents that flow through large volumes of mixed materials.
These tables illustrate that a wide range of variability can be expected, implying that it is difficult to use values of true chargeability obtained by inversion of IP data to determine exactly what type of rock or material is in the ground. However, this is an ongoing topic of research.
Table 1: Charging and discharging times (i.e. transmitter on and off times) were about one minute each, which is much longer than field survey systems, therefore values are larger than field measurements.
| Material type | Chargeability (ms.) |
| 20% sulphides | 2000 - 3000 |
| 8-20% sulphides | 1000 - 2000 |
| 2-8% sulphides | 500 - 1000 |
| volcanic tuffs | 300 - 800 |
| sandstone, siltstone | 100 - 500 |
| dense volcanic rocks | 100 - 500 |
| shale | 50 - 100 |
| granite, granodiorite | 10 - 50 |
| limestone, dolomite | 10 - 20 |
Table 2: The values in this table involved more commonly used charging and integration times of 3 sec and 0.02-1.0 sec respectively.
| Material type | Chargeability (ms.) |
| ground water | 0 |
| alluvium | 1 - 4 |
| gravels | 3 - 9 |
| precambrian volcanics | 8 - 20 |
| precambrian gneisses | 6 - 30 |
| schists | 5 - 20 |
| sandstones | 3 - 12 |
| argilites | 3 - 10 |
| quartzites | 5 - 12 |
Table 3: Chargeability of minerals at 1% concentration in the samples (charging and integration times as per Table 2).
| Material type | Chargeability (ms.) |
| pyrite | 13.4 |
| chalcocite | 13.2 |
| copper | 12.3 |
| graphite | 11.2 |
| chalcopyrite | 9.4 |
| bornite | 6.3 |
| galena | 3.7 |
| magnetite | 2.2 |
| malachite | 0.2 |
| hematite | 0.0 |
