|
EM-31; ground conductivity and in-phase |
|
Survey designFor EM-31 surveys, rapid acquisition of spatially dense data sets is usually the most important requirement. When searching for discrete targets, the most important design consideration is to avoid spatial aliassing. For small 3D targets a tightly spaced grid would be required. For 2D targets (such as buried utility pipes), data spacing along profile lines would likely be tighter than spacing between lines, assuming lines can be placed perpendicular to target orientation. At our field site, EM-31 data were gathered on a 2m grid resulting in measurements of in-phase and quadrature response at 2600 stations. Since the instrument response to elongated buried objects depends upon the orientation of the instrument, two complete data sets were gathered, with the instrument's 3.66 m boom oriented both in north-sourth and east-west directions. Data providedBoth complete data sets are presented here. They were recorded using the "normal" vertical dipole coil orientation with the instrument held 1 m above the ground. Click the following small images to display larger versions of each image.
Apparent conductivity data are presented in units of milliSeimens per m (mS/m) using a rainbow colour scale with banding so that values and local trends are both visible. Corresponding in-phase data are in percent of primary field strength, and are presented using a bimodal colour scale since results are generally interpreted qualitatively to identify buried metal rather than quantitatively in terms of ground material properties. Since data were gathered using two different instrument orientations, it is easy to supply averaged and differenced data sets as well. The effect of averaging data from two orientations is to smooth responses, emphasizing regions where ground is more uniform. The objective of differencing data from two orientations is to emphasize features that depend upon instrument orientation. For apparent conductivity data the result is that linear and small 3D targets are more clearly decerned. Click the following small images to display larger versions of each image.
Note that interpretation can be greatly enhanced by using animation to facilitate comparison between data sets that cover identical aras. We provide one page that allows the user to select static images, and a second page which allows the user to view "flicker" animations of pairs of data sets. Finally, the raw data are available as a spread sheet in the file called em-31.xls. |
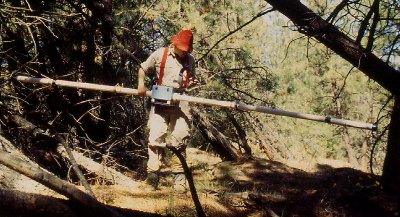 The Geonics EM-31 instrument is used to map variations of electrical conductivity within the top 3 to 6 metres of the sub-surface.
This chapter of our report summarizes survey design and results obtained. Detailed interpretation was not one of our contractual oblications.
The Geonics EM-31 instrument is used to map variations of electrical conductivity within the top 3 to 6 metres of the sub-surface.
This chapter of our report summarizes survey design and results obtained. Detailed interpretation was not one of our contractual oblications.