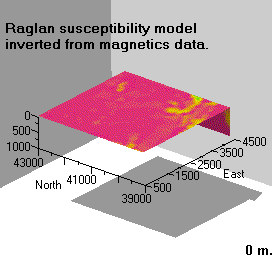
Raglan magnetic susceptibility model |
|
This animation shows a series of horizontal slices through the susceptibility model recovered by inversion of the Raglan magnetic data. The model is sliced horizontally at progressively deeper intervals, starting at the surface and ending at 1000m depth. The animation is roughly 89 kbytes, so loading may take a few seconds. High susceptibities are in blue, and zero background is red. Note that the ultramafic flow between outcrops is imaged between roughly 400 m and 900 m depth. It has relatively low susceptibilities (in yellow colours) compared to outcrop.
. © UBC-GIF
January 9, 2007

